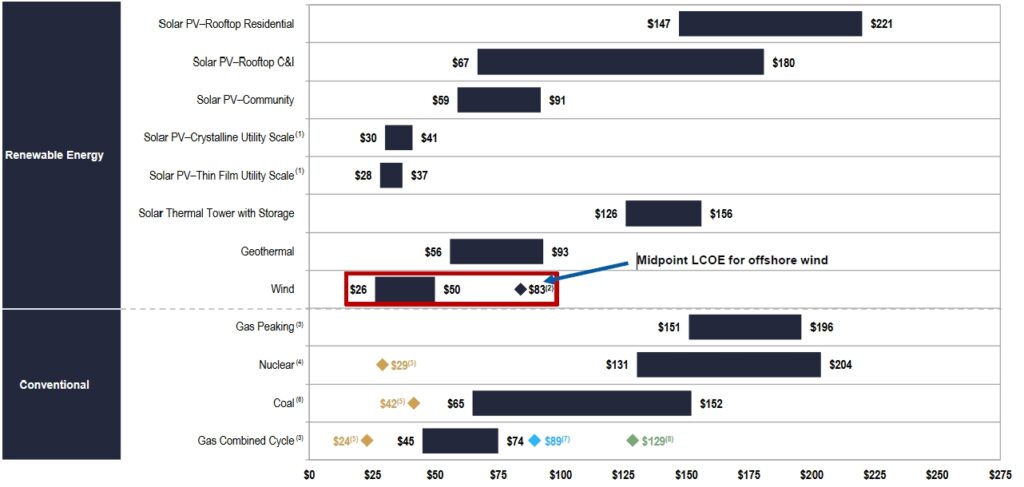
LCOE
Unsubsidized levelized cost of electricity (LCOE) in $/MWh in 2021
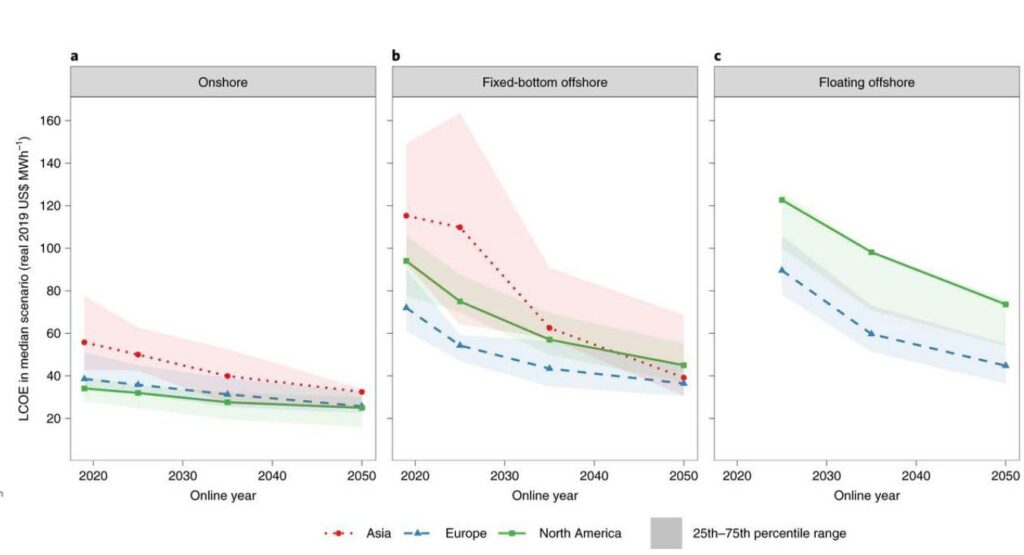
Median-scenario wind LCOE projections from 2020 survey of experts, 2021-2050
Financial Outlook
Cost of Energy (LCOE) projection
Global offshore wind capacity is projected to exceed 100GW by 2025, growing over 30% annually. Australia shows increased interest with over 10 proposed projects. Offshore wind, though mature, is costlier than established onshore renewables. However, costs are predicted to align in the 2040s, with the UK forecasting alignment in the late 2030s.
In Victoria, for example, onshore wind and solar energy will remain more cost-effective than offshore wind, although the difference is expected to decrease gradually.
Indicative Levelised Cost of Energy (LCOE) projection of offshore wind and onshore renewables in Victoria

Global Offshore Market Outlook to 2031
New offshore installations, global (MW)
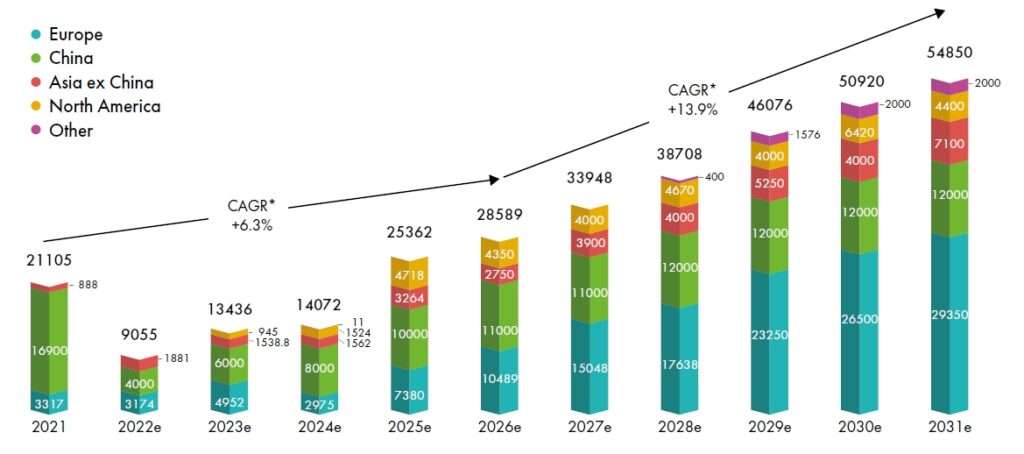
In 2021, the drive for global net zero commitments gained momentum at COP26, while concerns over energy independence and fossil fuel volatility intensified due to Russia’s actions in Ukraine. This has significantly boosted the outlook for the global offshore wind market in the medium and long term. Predicted growth rates of 6.3% until 2026 and 13.9% into the next decade anticipate installations exceeding 30 GW in 2027 and reaching 50 GW by the decade’s end.
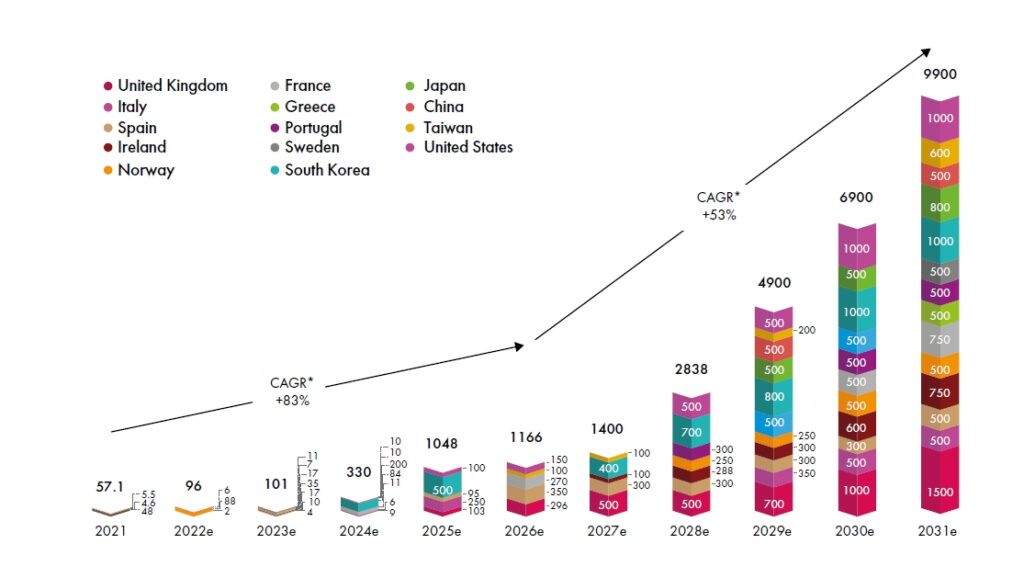
Floating Offshore Market Outlook to 2031
New floating wind installations, Global (MW)
Despite 80% of offshore wind potential residing in waters deeper than 60 meters, only 121.4 MW of floating wind capacity is operational worldwide, just 0.2% of total offshore wind. Progress since the first megawatt-scale floating turbine in Norway (2009) has advanced floating wind from testing to pre-commercial stages. The global pipeline now exceeds 120 GW, led by the UK, Portugal, Japan, Norway, and China. Global Wind Energy Council (GWEC) revised predictions to 18.9 GW global capacity by 2030, with 28.7 GW new capacity expected from 2022 to 2031—Europe contributing 59.2%, Asia 29.4%, North America 11.4%. This should elevate floating wind’s share to 7.8% by 2031, aided by GWEC’s Floating Offshore Wind Task Force (established in 2020).
Offshore Wind Turbine Technology Road Map
Excluding China
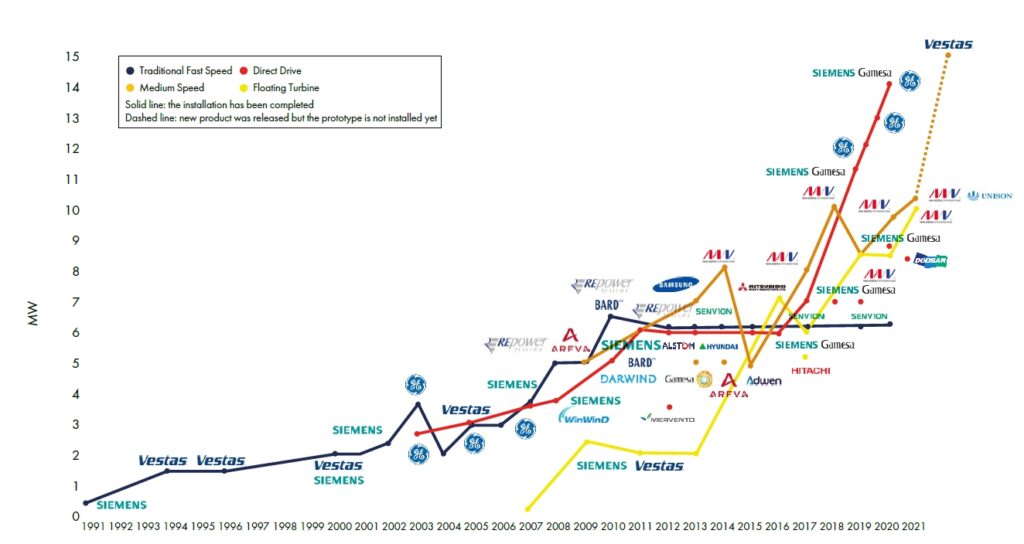
Over the past thirty years, the offshore wind sector has employed four drivetrain technologies. Presently, the dominant options in Europe are the direct drive turbine with a permanent magnet synchronous generator (DD PMSG) and the medium-speed turbine with the same (MS PMSG). These two technologies held nearly equal market shares in 2021.
China Only
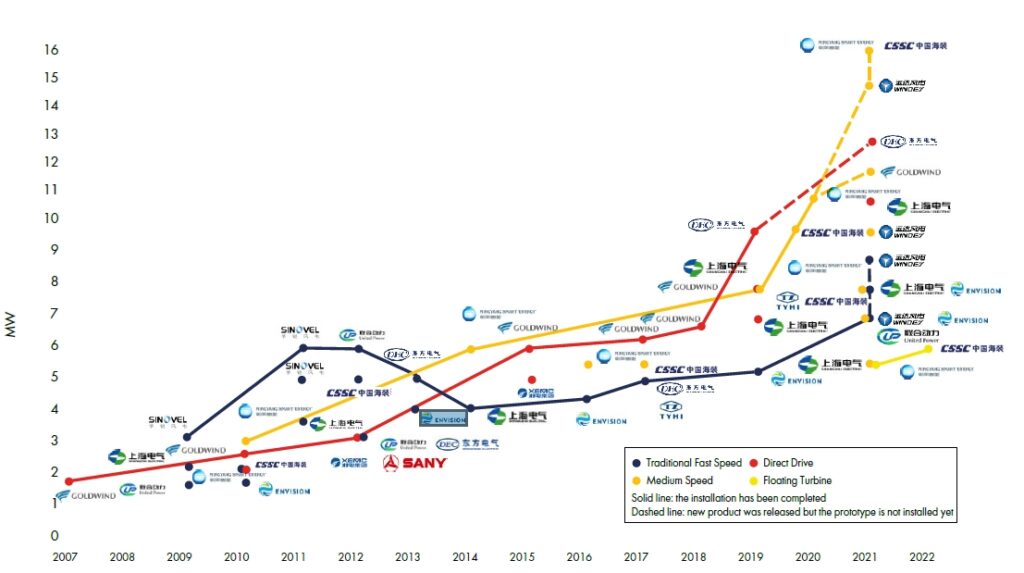
In China, alongside conventional high-speed wind turbines, the Double-Fed Induction Generator (DFIG), Squirrel Cage Induction Generator (SCIG), and High-Speed PMSG (HS PMSG) technologies remain in use, with SCIG holding the largest market share until 2021. DD PMSG gained traction from 2017 and became prominent in 2021, led by local suppliers like Goldwind, Shanghai Electric, Dongfang, and Harbin Electric. Fierce cost-based competition and rising material prices pressured DD producers.